Each year, residents across the Humber region share their views on crime, community safety and confidence in policing. The 2025 Police and Crime Plan Survey provide valuable insight into what matters most to communities and how these priorities are shifting over time. Last month we published the results of the Police and Crime plan survey, which can be found here.
We promised a weekly blog with a specific topic of the survey. In this second blog we look at how levels of confidence in Humberside Police differ across our communities.
Why ask about perceptions of crime and ASB?
We asked this question as our communities’ perceptions on crime and ASB may differ from what the recorded statistics are telling us. For example, ONS[1]data tells us that crime in Humberside decreased by 5% in 24/25 compared with 23/24. However, this was not reflected in our survey as our communities perceived that crime and ASB had increased over the past year.
[1]https://www.ons.gov.uk/peoplepopulationandcommunity/crimeandjustice/datasets/policeforceareadatatables (Year ending March 2025)
Perceptions of crime
% of respondents that perceived that crime levels had risen, remained the same or fallen since last year.
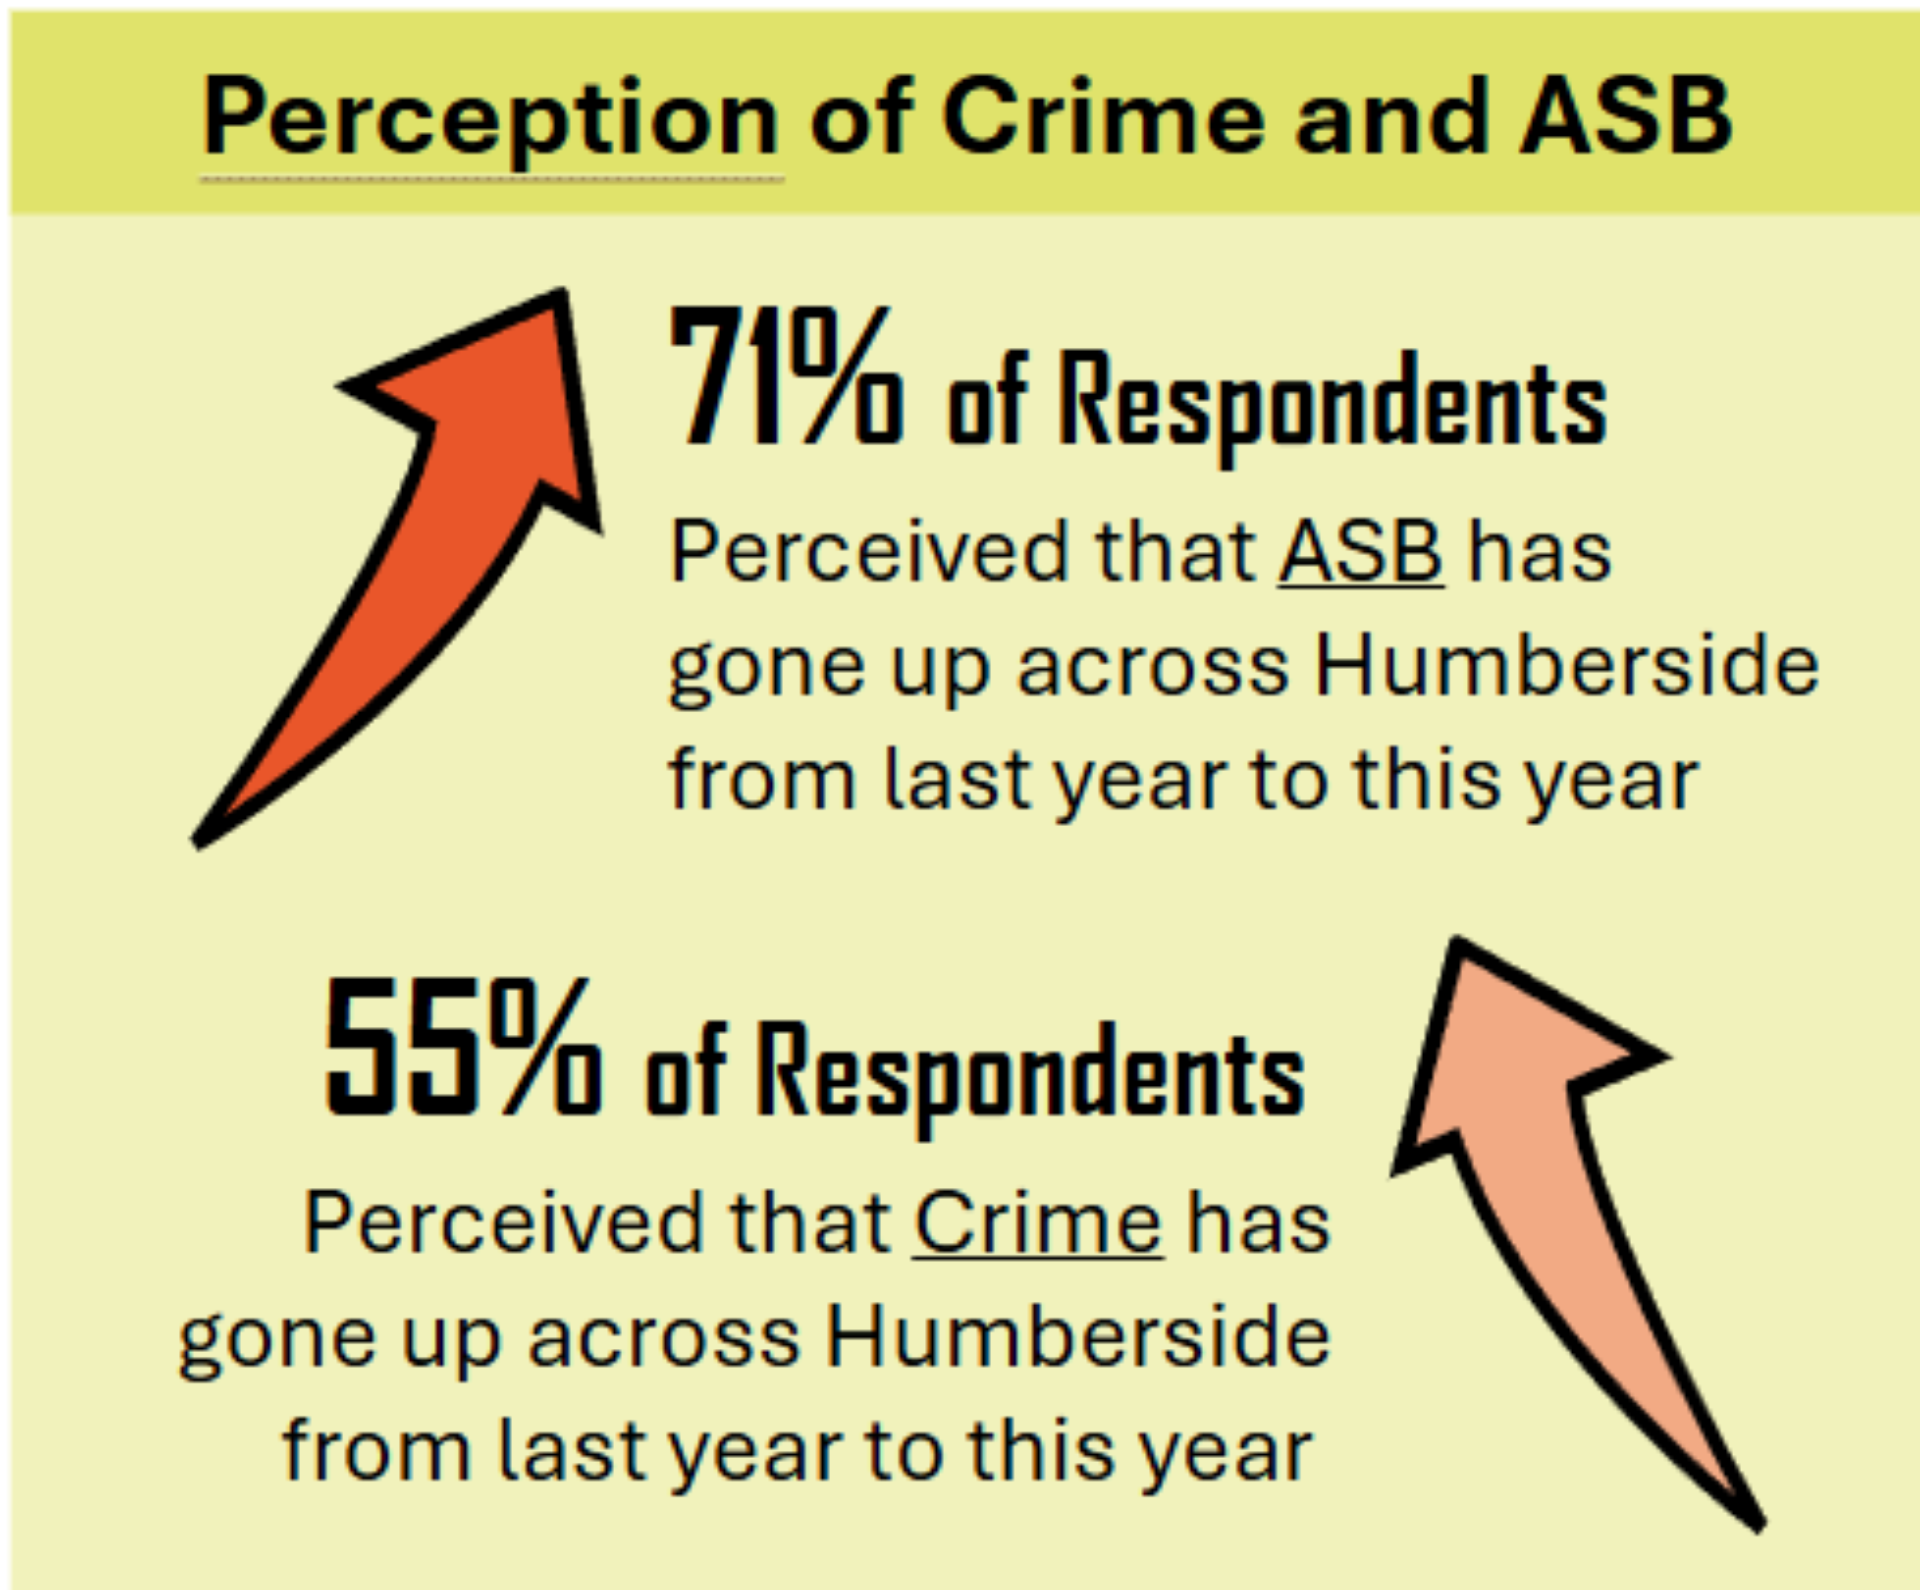
Over half of the survey respondents perceived that crime has increased since last year. This was slightly higher for crime across the whole of Humberside, compared to local areas.
| Area | Gone up | About the same | Gone down |
|---|---|---|---|
| Humberside | 55% | 37% | 8% |
| Local area | 50% | 41% | 8% |
In comparison to last year survey a higher percentage of respondents believed than crime had increased in their local area. Last year, 41% felt crime had increase local area compared to 50% in this year’s survey.
Differences by Local Authority
- Residents in Hull perceived that crime has increased the most across the whole of Humberside at 62%. This is 7 percentage points higher the survey average.
- On the other hand, NE Lincs residents had the lowest level at 51%, 4 percentage points lower than the survey average.
- Notably, across all 4 Local Authorities the perception is that crime has increased more across the whole of Humberside, compared to their local area.
Urban and Rural Differences
There were also differences between the rural and urban survey populations:
- Residents in urban areas show the highest concern: 57% thought crime in Humberside has increased
- Smaller rural areas show the lowest: 46% felt crime had risen.
Deprivation and perceptions of crime
Perceptions also varied depending on levels of deprivation, as measured by the Index of Multiple Deprivation (IMD). Generally, those living in areas with higher deprivation were most likely to feel crime has increased 59% for Humberside and 58%; in contrast to those living in our least deprived areas, which was found to be 52% for Humberside and 46% for their local area.
ASB Perception: A Sharper Rise Than Crime
ASB Across Humberside vs. Local Areas
More than 7 in 10 believe ASB has risen region‑wide, higher than the 55% who felt the
same about crime. This pattern was also seen for ASB in their local area as 59% of respondents perceived that ASB has increased compared with 50% for crime.
% of respondents the perceived that ASB had risen, remained the same or fallen since last year.
| Area | Gone up | About the same | Gone down |
|---|---|---|---|
| Humberside | 71% | 24% | 5% |
| Local area | 59% | 33% | 8% |
In the previous survey, 45% believed ASB had increased locally. This year it at 59%, is an increase of 14 percentage points.
Urban and Rural Differences
- Smaller rural areas consistently showed the lowest concern - only 41% think ASB is rising locally
- Urban areas again report the highest levels of concern - 63% locally and 73% Humber-wide.
Deprivation and perceptions of ASB
- Residents living in the least deprived areas perceived that ASB had increased the most across the whole of Humberside (74%).
- However, when examining perceptions at a local level, respondents in our most deprived areas perceived that ASB had increased the most (65%).
Which Crimes Do People Think Happen Most Often?
Respondents were also asked how frequently various crime and ASB types occur in their local area. These were the top four most frequent (rated “Often” or “Very Often”):
- Dangerous Driving (63%)
- Drug‑Related Crime (55%)
- Neighbourhood Nuisance (41%)
- Burglary and Theft (38%)
These match the top four from last year’s survey and Police and Crime Priorities from this survey.
Comparing to 2024 Results
Only three incident types saw an increase in perceived frequency when comparing results from this survey to the 2024 survey:
- Burglary and Theft (+3%)
- Knife or Weapon‑Enabled Crime (+3%)
- Sexual Violence or Abuse (+4%)
Meanwhile, Neighbourhood Nuisance saw a decline from 53% last year to 41% this year, a decrease of 12 percentage points.
Final Thoughts
The 2025 survey paints a picture of rising concern across Humberside, particularly around ASB. While perceptions vary by location and deprivation, the overarching theme is clear: a greater proportion of people feel crime and ASB are worse than last year, and ASB generates the greatest concern, more so across Humberside than their local neighbourhoods.
Full responses
Read the full consultation response summary


